Databox vs Datapad: The best BI Tool for you

Table of Contents
Hook / Introduction
In this Age of AI and high-speed computing, Business Intelligence tools have become critical for any business or organization to get ahead. Every organization generates data these days, and extracting actionable intelligence from said data can help organizations identify their shortcomings, identify new opportunities, and test out new products. While there are plenty of BI tools on the market, today we will be comparing Databox and Datapad.
While both tools are designed to simplify data visualization and KPI tracking, their features, pricing, and usability cater to different needs. Hopefully, by the end of this article, you’ll be able to decide which BI tool is best suited for your business needs.
Key Features
| Features | Databox | Datapad |
| Ease of Use | Moderate, but has 300+ prebuilt templates | High (drag-and-drop interface) |
| Customizability | High | Low |
| Integrations | 70+ integrations | Comparatively less range of integrations |
| Real-Time Alerts | Yes, but with slower refresh rates | Yes, faster updates |
| Client Focus | Agency features but limited automation | Highly focused on agency needs |
| Dashboard Customization | Advanced but complex tools | Simpler customization |
| Customer Support | Catered toward enterprise clients | Personalized for small organizations |
| Mobile Optimization | Limited | Excellent |
| Pricing | Free and paid plans (starting at $91/month) | Competitive, but less explicit |
Databox
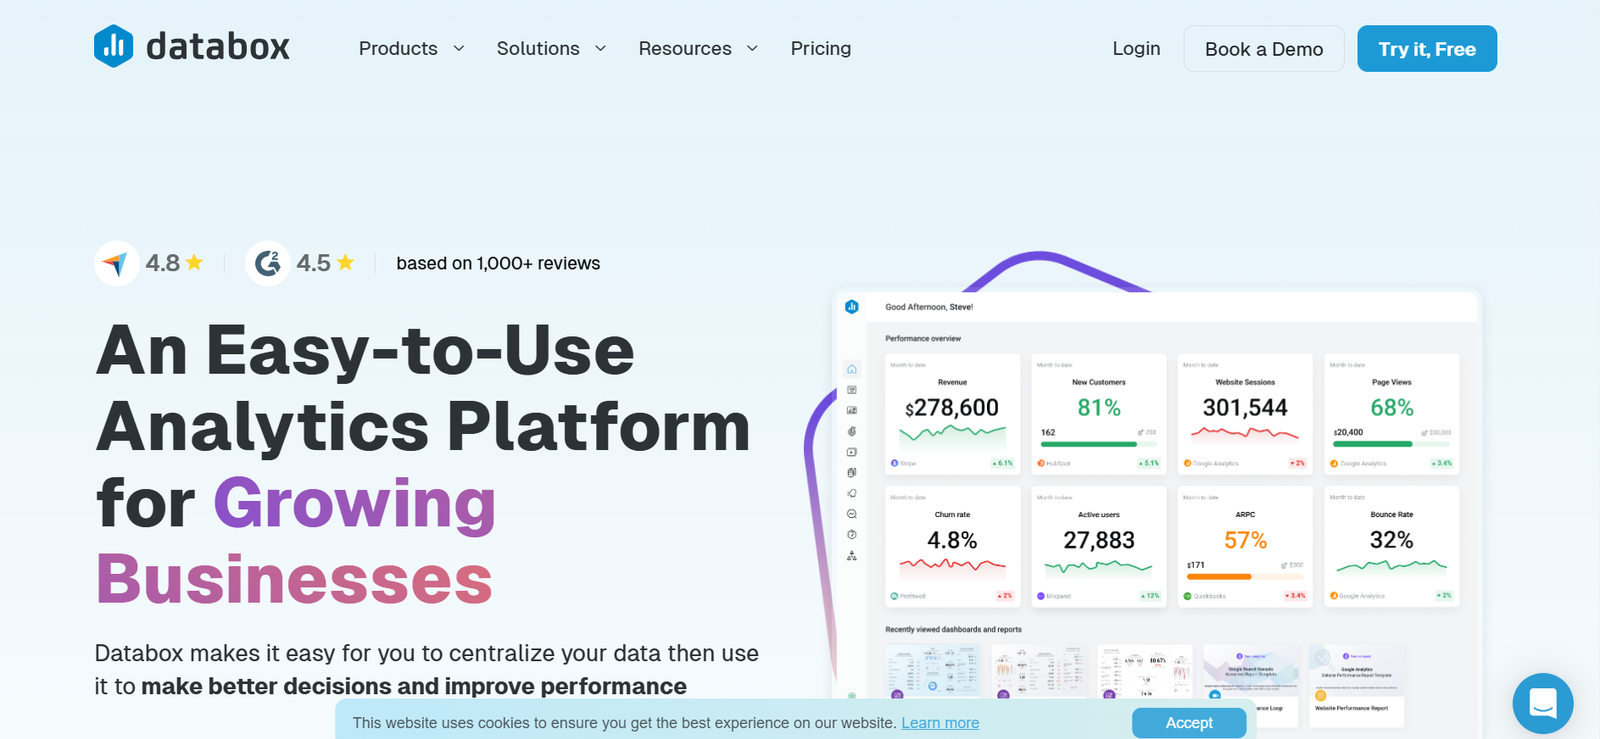
Databox is a quite popular BI tool that specializes in creating visually appealing dashboards and tracking performance metrics across various platforms. This makes it quite useful for marketing teams and mid-sized businesses looking to streamline their data pipeline.
Data integration is the name of the game when it comes to choosing an ideal BI tool, and Databox does it quite well. It allows you to link multiple platforms and APIs directly to your Databox account, so you can monitor key metrics across all your platforms in real-time. The integration capability is quite extensive and currently, it supports 70+ platforms including all the major platforms Google Analytics, HubSpot, Salesforce Facebook Ads, etc.
Databox also allows you to set up custom metrics by using its metric builder, so you can custom-tailor a solution according to your organization’s needs. While this is powerful, there is a learning curve to it, as you may require some knowledge of SQL to do it.
If that doesn’t work for you, Databox offers 300+ prebuilt templates, that users can use to quickly set up their dashboard and then tailor it to their needs. Instead of building one from scratch.
Another great feature that a lot of users might appreciate is the automatic alerts and notifications. Users can turn on this feature and define its parameters to keep track of selected metrics that they deem important. If that metric doesn’t meet your defined goals or if that metric falls below a limit, you will be immediately notified via email, slack notification, or mobile notification. This makes it easier for you to monitor key indicators, even if you are on the go.
Databox also allows for integrated client reporting. This allows you to easily manage clients across multiple platforms without constantly switching between said platforms. It can be quite tedious for marketing or support teams to manage clientele across multiple platforms and databox makes it just a tad bit easier.
While the learning curve is quite steep with Databox, you can get more out of it as well if you set up your data pipeline and dashboard right. And the good thing is, if you are having any issues, Databox has an amazing customer support system that can aid you through the whole process.
Datapad
Datapad’s approach to business intelligence is mobile first. Their whole user experience is focused on users who need access to business insights on the go. This means that there is a focus on simplicity and ease of use over powerful customization options. But regardless, it has earned quite a loyal fan base.
One of the main things that draws people towards Datapad is its user-friendly interface. Datapad has a drag-and-drop dashboard builder that simplifies the process of organizing and visualizing data, even for non-technical users. This feature is further enhanced by a clean, intuitive interface that minimizes the learning curve. For some organizations with simpler data integration needs, this can be quite appealing.
The focus on mobile optimization helps seamless dashboards on smartphones and tablets, making it suitable for on-the-go professionals. Users can manage data and generate reports directly from their mobile devices.
There is also an emphasis on team collaboration. The platform’s collaborative features allow teams and clients to access shared dashboards, fostering transparency and trust. If collaboration and transparency are something your organization values, Datapad might just be the business intelligence tool for you.
Dashboard
Looking at dashboards for both business intelligence tools, both Databox and Datapad offer unique strengths that are tailored for different users. Let’s take a look detailed look at what both have to offer in terms of dashboards and data presentation.
Databox
Databox has a very targeted focus on the customizability of data presentation. Their dashboards are known for their sleek and visually stunning designs, making them perfect for presentations and reports. Users can create dashboards that are highly customizable in layout, design, and color schemes. This makes Databox the perfect platform for users who are looking to tailor their own custom experience.
Databox also offers a wide range of pre-built widgets that you can integrate into your data management and data analysis pipeline. This is particularly useful for users tracking common KPIs across industries like marketing, sales, and finance.
Dashboards in Databox can be shared via links, PDF reports, or even embedded on websites. This flexibility is ideal for client presentations and team collaborations.
Datapad
Datapad prides itself on offering a more user-friendly and simplistic approach to things. Their dashboard is straight board and simple, making it easier for your team to quickly get a hand of the ropes. This ensures that even non-technical users can easily create and modify dashboards with ease.
Another great thing about Datapad dashboards is that they are optimized for mobile devices, ensuring smooth navigation and real-time updates on smaller screens, making Datapad an excellent choice for users who frequently work remotely or travel.
Pricing Structure
Databox
The main appeal for Databox in terms of pricing is that it offers a free tier for users who are just starting out. The free tier allows up to 3 data connections and is more tailored towards individuals or small teams. Multiple paid tiers are more powerful and meet the needs of larger organizations from startups to enterprises. Paid plans start at $ 59/month and go up to $ 999/ month. The platform emphasizes affordability alongside robust features. Users often find Datapad to be a cost-effective alternative to larger BI tools.
Datapad
Datapad offers competitive pricing with a strong focus on providing value to smaller teams and agencies. It also has a free tier that allows you to set up one dashboard. The other two paid tiers are priced at $ 21/ month and $ 140/ month. The paid tiers offer includes 5 dashboards and unlimited dashboards respectively. To access the automated reporting feature, you will have to get onto one of the paid plans though, so keep that in mind. The free tier is mostly designed for teams to try out the platform, integrating Datapad into your organization’s data pipeline will require you to purchase one of the plans as the free plan doesn’t have most of the features you would need in a business intelligence tool.
Customer Support
Databox
Databox is designed for more tech-savvy users. And that design philosophy is also reflected in their customer support experience. They do offer 24/7 customer support for its higher-tier plans, while lower-tier users typically have access during standard business hours. Paid users benefit from live chat support, ensuring quick responses to urgent queries. However, some users have reported delays during peak hours. Enterprise customers receive a dedicated account manager for tailored support and onboarding.
The platform also provides an extensive knowledge base, complete with articles, videos, and guides. This helps users troubleshoot common issues independently.
Datapad
Datapad’s focus is more on personalization and meeting the needs of smaller organizations. Datapad emphasizes quick and efficient support, often praised for its fast response times, even for users on basic plans. New users are guided through onboarding processes, ensuring a smooth transition to the platform. Similar to Databox, Datapad offers a library of tutorials, FAQs, and documentation to empower users to solve issues independently.
Smaller user bases often allow Datapad to offer more personalized support, enhancing the customer experience.
Concluding Remarks
Both Databox and Datapad are powerful BI tools, but they cater to slightly different audiences. If your organization requires extensive integrations and advanced customization, Databox is a strong contender. On the other hand, if you prioritize ease of use, real-time updates, and mobile accessibility, Datapad might be a better fit.
Ultimately, the choice between Databox and Datapad depends on your specific business needs, technical expertise, and budget. By evaluating your priorities and testing out each platform’s free offerings, you can make an informed decision that aligns with your goals. Additionally, consider the scalability of each tool—while Databox might be better for larger organizations, Datapad’s adaptability makes it a strong contender for small to medium-sized businesses looking for affordable yet powerful solutions.